ABM Helaluddin1 ![]() ,
Reem Saadi Khalid1,
Mohamed Alaama1,
Syed Atif Abbas2
,
Reem Saadi Khalid1,
Mohamed Alaama1,
Syed Atif Abbas2
For correspondence:- ABM Helaluddin Email: abmhelal@iium.edu.my
Received: 20 August 2015 Accepted: 4 January 2016 Published: 28 February 2016
Citation: Helaluddin A, Khalid RS, Alaama M, Abbas SA. Main analytical techniques used for elemental analysis in various matrices. Trop J Pharm Res 2016; 15(2):427-434 doi: 10.4314/tjpr.v15i2.29
© 2016 The authors.
This is an Open Access article that uses a funding model which does not charge readers or their institutions for access and distributed under the terms of the Creative Commons Attribution License (http://creativecommons.org/licenses/by/4.0) and the Budapest Open Access Initiative (http://www.budapestopenaccessinitiative.org/read), which permit unrestricted use, distribution, and reproduction in any medium, provided the original work is properly credited..
Heavy metal pollution is a serious environmental problem. The presence of such metals in different areas of an ecosystem subsequently leads to the contamination of consumable products such as dietary and processed materials. Accurate monitoring of metal concentrations in various samples is of importance in order to minimize health hazards resulting from exposure to such toxic substances. For this purpose, it is essential to have a general understanding of the basic principles for different methods of elemental analysis. This article provides an overview of the most sensitive techniques of elemental analysis such as atomic absorption/emission spectrometry, mass spectrometry, x-ray fluorescence, voltametry, and nuclear techniques. In addition, the article addresses some applications in a range of sample matrices.
Introduction
Heavy metals are present in all types of ecosystems. Their existence is mainly due to anthropogenic sources such as industrial and agricultural activities [1]. Waste from such activities contributes to the pollution of water bodies and soil, affecting the growth of plants and aquatic life [2]. A large portion of these pollutants can ultimately be traced to various consumable items such as dietary, supplementals, natural medicinal remedies, cosmetics, and various other commercial products [3]. Within the literature, the presence of heavy metals in various samples such as soil [4], diet [5] and natural medicinal products [6] [7] has frequently been reported. Long term exposure even to low concentrations of heavy metals can cause many adverse health effects and even toxicity [8].
Some heavy metals are essential to maintain normal human body functions at trace amounts. However, they may be dangerous or even toxic if present at higher concentrations [9,10]. Heavy metals such as lead (Pb), mercury (Hg), cadmium (Cd), and arsenic (As) are substantially toxic elements known for their ability to bioaccumulate in the human body, resulting in multi-organ disruption [11]. The mechanism of toxicity for heavy metals can be explained by their ability to interact with nuclear proteins and DNA, causing oxidative deterioration of biological macromolecules [12]. Due to the metals’ toxicity and their adverse effects on the public health and the environment, it is essential to precisely measure their levels in different samples. This article summarizes basic theories of different techniques for the detection of heavy metals, as well as highlighting some of their applications in various sample matrices.
Many instrumental analytical methods may be employed to measure the concentration level of heavy metals in various samples. The most predominant techniques are atomic absorption spectrometry (AAS); atomic emission/ fluorescence spectrometry (AES/AFS); inductively coupled plasma mass spectrometry (ICP-MS); inductively coupled plasma optical emission spectrometry (ICP-OES); neutron activation analysis (NAA), X-ray fluorescence (XRF); and anodic striping voltammetry (AVS).
Atomic spectroscopy
In general, atomic spectroscopy is comprised of atomic absorption, emission and fluorescence. Basically, each atom is composed of a nucleus bordered by electrons. Every element has a specific number of electrons connected to its nucleus. The most stable orbital configuration of an atom is known as the "ground state. When energy is applied to an atom, a known quantity of energy with a given wavelength will be absorbed and an outer electron then promoted to a less stable configuration known as the "excited state." Since this state is unstable, the atom will spontaneously return to the "ground state," releasing light energy. The process of excitation and decay to the ground state is involved in all three fields of atomic spectroscopy [13].
Atomic absorption spectrometry (AAS)
AAS is a quantitative method of metal analysis suitable for the determination of approximately 70 elements. This method measures the concentration of the element by passing light in specific wave length emitted by a radiation source of a particular element through cloud of atoms from a sample. Atoms will absorb light from an energy source known as hollow cathode lamp (HCL).
The reduction in the amount of light intensity reaching the detector is seen as a measure for the concentration of particular element in the original sample.
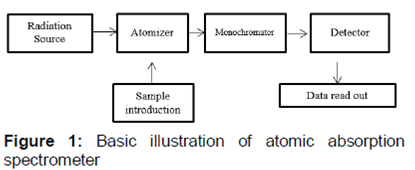
A typical AA spectrometer consists of energy (light) source, sample compartment (atomizer), monochromator, detector, and a data process system ().
The radiation source is usually a hollow cathode lamp (HCL) or electrodeless discharge lamp (EDL), while different atomizers are used in various AAS techniques such as flame, a graphite furnace, or a quartz tube. The Monochromator is eliminating scattered light of other wavelengths by a number of lenses and mirrors to focus the radiation and the detector is typically a photomultiplier tube that converts the light signal to an electrical signal proportional to the light intensity [14].
Flame atomic absorption spectrometer (FAAS)
FAAS is a suitable technique for determining metals at part per million (ppm) concentration levels with good precision for many elements. FAAS offers air-acetylene and/or nitrous oxide flame atomizer. Samples are introduced into the atomizer as an aerosol by the nebulizer. FAAS technique provides fast analysis of 10-15 s per sample, with very good precision (repeatability), moderate interferences that can be easily corrected, and relatively low cost [15]. FAAS was successfully applied for the determination of heavy metals in various matrices. Some elements like arsenic (As) and zirconium (Zr) may not be determined by FAAS because the maximum atomization temperature is not sufficient to induce complete atomisation.
In herbal medicine, lead (Pb), cadmium (Cd), copper (Cu) and zinc (Zn), were estimated via FAAS in thirty-four samples sold in Indian markets [16]. In Pakistan, FAAS was used to determine heavy metal levels for Pb, Cd, nickel (Ni), chromium (Cr), manganese (Mn), Zn, Cu, and iron (Fe) in certain branded herbal medicines [7]. Cd was found to be at a concentration of 16.438 to 29.796 ppm in twenty Nigerian herbal drugs used as anti-malarials using FAAS [17]. Cd and Pb were found in snake fruit samples available in Indonesian markets using FAAS. In FAAS moderate interferences can be easily corrected such as background interference due to light scattering by particles in the flame which is usually controlled by the use of deuterium based lamp [18].
Graphite furnace atomic absorption spectroscopy (GFAAS)
GFAAS is an appropriate atomization technique used to determine analytes concentrations in samples with an acceptable limit of precision at the parts per billion (ppb) level. In this technique, samples are mixed with modifiers prior to the atomization processes and dispensed into a graphite tube (atomizer) which is programmed to be heated in series of steps, including drying, ashing, and atomizing to remove the solvent and matrix components and to atomize the remaining sample. The atomized sample is retained within the tube and the light path for a prolonged period of time, which leads to an improvement in sensitivity [13]. Chemical interference is relatively low due to the use of chemical modifiers to stabilize the analyte and make the matrix more volatile; hence, it contributes in further improvement to the sensitivity of this technique. GFAAS has a very good detection limits for majority of elements, as a small sample size of 20 µl is required for analysis, However, the technique has some disadvantages like limited working range, slow analysis, and high cost.
In twenty-five samples of traditional medicine available in the East Coast Region of Malaysia. Pb, Cd, and Ni were detected by GFAAS and found to be in the concentration ranges of 1.51-19.35, 0.1-1.23, and 2.4 -14.94 ppm, respectively [19]. GFAAS was applied to evaluate the level of trace amount of heavy metals in twenty-four medicinal plants and the highest mean value for each metal was Cd 12.06 ppm, Cr 24.50 ppm, Cu 15.27 ppm, Pb 0.96 ppm, Fe 885.6 ppm, Mn 90.60 ppm, Ni 9.99 ppm and Zn 77.15 ppm [20]. Non-volatile metals Pb and Cd were monitored in ginger samples using GFAAS and ranged from 0.06 to 0.64 and 0.002 to 0.03 ppm, respectively [21].
Hydride generation atomic absorption spectroscopy (HGAAS)
Some elements, mostly metalloids like antimony, arsenic, selenium, and tellurium, are regularly measured by HGAAS atomization technique. In the hydride technique a continuous flow system involves the reaction of acidified aqueous samples with a reducing agent such as sodium borohydride to generate volatile hydride, which is then transported to the heated quartz cell (atomizer) along the optical axis of the conventional AAS by mean of an argon gas. In the quartz cell the hydrides are converted to gaseous metalloid analyte atoms in the path of a source lamp and a signal is generated by measuring the amount of light absorbed. HGAAS technique is restricted to certain elements. The quality of the results is subjected to different parameters, such as the valence state of the analyte, gas pressures, acid concentration and the cell temperature. Thus, achieving high quality data in this technique required high skill operator [22].
Arsenic concentrations were determined via HGAAS in 100 samples of crops and vegetables collected from three different regions of Bangladesh. Different parts of rice plants were studied; roots, stems, and grains had mean concentrations of As 2.4, 0.73, and 0.14ppm, respectively. Arsenic contents of vegetables varied from 0.09–3.99 ppm for Colocasia antiquorum, 0.07–1.36 ppm for Solanum tuberisum and 0.1–1.53 ppm for Ipomoea reptoms [23]. HGAAS was applied for the determination of As in canned tuna fish from the Persian Gulf area of Iran. As concentration varied from 0.0369 to 0.2618 with an average value of 0.128 ppm [24]. The hydride method was used was developed for the determination of arsenic in food samples consumed in Slovakia, such as sea fish, rice, and yeast. Mean concentrations were 0.039, 0.036, and 0.075 ppm, respectively [25]. Arsenic was detected in sixty samples of natural medicinal products available in the East Coast region of Malaysia using HGAAS. Twenty-six samples contained as in a range of 0.2150 - 1.3254 ppm [26].
Cold vapour atomic absorption spectrometer (CVAAS)
The unique characteristic of mercury allows its vapour measurement at room temperature. Thus, CVAAS is a flameless AAS procedure for mercury detection method based on the absorption of radiation at 253.7 nm by Hg vapour. The mercury is first reduced to the elemental state by a strong reducing agent such as sodium borohydride or stannous chloride. The mercury vapour passes to the absorption cell positioned in the light path of the spectrophotometer by argon carrier gas [22].
CVAAS has been applied for Hg analysis in various samples, mainly marine fish species as well as some natural remedies. Fifty-six fish samples of edible muscle tissue from the Atlantic coast of Ghana were analysed for mercury content concentrations, ranging from 0.004 to 0.122 ppm [27]. Four fish species collected from the fish markets of Karachi, Pakistan were analysed for Hg via CVAAS. The results obtained showed that Hg concentration was in the range of (0.721- 1.41) ppm [28]. Hg was detected in one hundred products of rhizome of Smilax luzonensis using CVAAS. All samples were purchased from a Malaysian market. The results obtained showed that fourteen samples contained 0.51–1.23 ppm of Hg [29]. Hg was also detected by CVAAS in various pharmaceutical dosage forms of tongkat Ali hitam preparations available in Malaysia. From one hundred samples twenty-six products were contained Hg at a range of 0.53–2.35 ppm [30].
Both analytical methods HGAAS and CVAAS are characterized in low detection limits, fast measurement (30-50 second per sample) and minimum interferences. However, analytical procedures are tedious and require high consumption of chemical reagents.
Atomic emission and fluorescence spectroscopy (AES and AFS)
In the AES technique, high energy promotes the atoms into excited electronic states that subsequently emit light when they return to the ground electronic state. Each element emits light at a characteristic wavelength, which is isolated by a grating and detected via a spectrometer. The wavelength of the atomic spectral line provides the identity of the element, while the intensity of the emitted light is proportional to the number of atoms of the element. In AFS combines aspects of both atomic absorption and atomic emission. The ground state atoms generated in a flame are excited by focusing a beam of light into the atomic vapour. Subsequent emission from the decay of the atoms excited by the source light is measured [14]. AES was applied for the detection of calcium (Ca), potassium (K), magnesium (Mg) and sodium (Na) in twenty-three samples of edible wild growing mushroom species collected throughout Poland [31]. Arsenic and mercury were found in traditional Chinese medicine using AFS with limits of detection ranging from 0.061 to 0.19 ppm for mercury and arsenic, respectively [32]. However, atomic absorption is the most widely applied method compared to AES and AFS.
Inductively Coupled Plasma Mass spectrometry (ICP-MS)
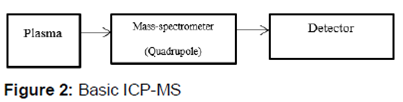
ICP-MS is a quantitative multi-element measuring system that offers wide detection range of elements. ICP-MS uses an argon plasma source to dissociate the sample into its basic atoms or ions. The ions are released from the plasma and handed into the mass spectrometer, where they are isolated according to their atomic mass-to-charge ratio by a quadrupole or magnetic sector analyser. In this circumstance, metal ions are detected rather than the light that they emit. Samples are introduced to the plasma torch in either gaseous or aerosol form (). Therefore, liquid samples require sample nebulization. The liquid sample is pumped from a vial via a peristaltic pump and the high number of ions produced, combined with very low backgrounds, provides good detection limits for most elements, normally in the parts-per trillion (ppt) ranges [33].
ICP-MS was applied for multi ultra-trace element analysis in sea water samples of highly saline matrix after the addition of ammonium tetramethylene dithiocarbamate methyl isobutyl ketone for sample preconcentration and matrix removal prior to analysis to minimize the interferences and improve the stability [34]. ICP-MS was used for the analysis of selected trace elements in sixty traditional herbal medicines in various dosage forms. Zn, Mn, Cu, Se, and Cd in Chinese and Malay traditional herbal medicines were found in concentrations ranging from (0.61–30.90)-(0.29–74.03), (10.21–241.88)-(0.31–542.10), (0.24–8.49)-(0.40–28.95), (0.03–2.03)-(0.04–0.74) and (0.07 -0.39)-(0.01 and 0.30) ppm, respectively [35]. Lipsticks samples were subject to Pb analysis by ICP-MS with a detection limit value of 0.04 ppm Pb after microwave-assisted digestion was performed prior to analysis. The average value obtained for the lipsticks was 1.07 ppm [36].
Inductively coupled plasma/optical emission spectrometry (ICP-OES)
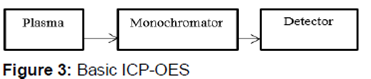
Inductively coupled plasma/optical emission spectrometry (ICP/OES) is a spectroscopic technique suitable for trace elements analysis in several types of samples. The technique is based on the unprompted emission of photons from atoms and ions that have been excited in a radiofrequency (RF) discharge. Samples are usually introduced into the plasma in liquid form; thus, solid samples require acid digestion prior to injection, while gas and liquid samples may be injected directly into the instrument. The sample solution is converted to an aerosol then sends into the centre of the plasma which maintains high atomization temperature of around 10,000 K. As the plasma free atoms in the gaseous state are generated and adequate energy is often available to convert the atoms to ions then promote the ions to excited states. The ionic excited state species may then return to the ground state via emission of photons. Specific wavelength of the photons can be used to identify the elements and the number of photons is directly proportional to the concentration of the element in the sample (). A variety of sample introduction methods are used in this technique such as nebulization, hydride generation (HG) for certain elements such as arsenic, selenium, and antimony, as well as electrothermal vaporization (ETV) and laser ablation [33].
Quantitative determination of As, Cu, Zn, Cd, and Pb in soft drink samples collected from several regions in Turkey was conducted by ICP-OES. The mean concentration levels of the metals were found to be 0.037, 0.070, 0.143, 0.005, and 0.029 ppm respectively [37]. Ten elements were detected specifically Cr, Cd, Cu, Fe, Mg, Mn, Ni, cobalt (Co), Zn, and aluminium (Al) in four edible part of the marine fish species from Parangipettai Coast, south east coast of India using ICP-OES. Concentrations of the heavy metals in fish samples were as follows: 0.65 – 0.92; 0.18 – 0.54; 0.12 – 0.31; 24.1 – 50.3; 0.54 – 1.21; 0.31 – 1.20; 0.38 – 1.54; 0.05 – 0.28; 14.1 – 33.5; and 14.1 – 33.5 ppm [38]. ICP-OES has been used for the determination of Hg, Cd, Pb, and As in marine fish and shellfish from the Straits of Malacca the West region of Peninsular Malaysia. The range of heavy metals in samples of fish and shellfish were 1-3-6.5- 3 ppm for Hg; 0.5-2 – 4.7-2 ppm for Cd; 0.01-0.39 ppm for Pb; and 0.14-6.57 ppm for As [39].
It can be observed from the above comparison that no single technique offers all of the advantages. However, modern spectroscopic analytical methods and instrumentation make possible the measurement of low level of concentrations with good accuracy and precision in various matrices. Therefore, they are considered superior tools in elemental analysis compared to other methods of element detection.
X-ray fluorescence (XRF)
XRF is a physical phenomenon involving the interaction of X-rays with matter. When high intensity X-ray radiation strikes an atom, it dislodges one or more of the tightly held electrons from the inner orbitals. This action makes the atom unstable. The unoccupied spaces in the lower orbital will be promptly filled by electrons from an outer shell. These electrons have a higher energy than the replacing electron. As a result of these processes, energy is released in the form of X-rays. Since the electronic energy levels for each element are different, the energy of X-ray fluorescence peak can be correlated to a specific element. X-ray fluorescence spectroscopy (XRFS) is an elemental analysis technique applicable for element coverage from sodium to uranium in various matrices that typically requires minimal sample preparation. A spectrometer usually consists of radiation (X-ray) source, sample chamber, detector, and a computer for data processing [40].
XRFS was used to determine essential and trace elements in three samples of lemon grass used in herbal tea preparation. Samples were collected from local fields of Karachi, Pakistan. Digestion processes were not included for this analytical method as it is suitable for solid, liquid, and powdered samples.
Mean concentration values for potassium (K), calcium (Ca), silicon (Si), sodium (Na), magnesium (Mg), iron (Fe), phosphorous (P), sulfur (S), aluminum (Al), manganese (Mn), copper (Cu), and zinc (Zn) were 54.02, 25.87, 9.02, 2.91, 2.08, 1.49, 1.57, 0.84, 1.16, 0.13, 0.15, and 0.15 ppm respectively. The method is guaranteed by the analysis of certified reference material and the recovery percentages of the elements were not significantly different from the certified values [41]. Another application of elemental analysis with XRFS was reported to evaluate the contamination level of heavy metals in soil samples collected from various areas near the industrial complex of Galati, Romania. Arsenic (As), chromium (Cr), copper (Cu), nickel (Ni), lead (Pb), vanadium (V), and zinc (Zn) were found in concentration ranges of 5.4-12.06, 52.91-101.26, <15-52.78, 41.93-62.67, 11.02-52.24, 59.50-110.74, and 34.07-121 ppm respectively [42].
Neutron activation analysis (NAA)
NAA is another type of analytical procedure used to detect the concentration of trace elements in different matrices. In this technique, the sample is exposed to a neutron flow after which radioactive isotopes for interest element are generated. As these radioactive isotopes decay to a lower energy state, they emit delayed gamma rays with characteristic energies for each element. Quantitative measurement of the concentrations of various elements may be achieved by determining the intensities of these gamma rays emitted from the radioactive isotopes which are proportional to the amount of the element in the sample. Several advantages have been recorded for this method, such as the ability to analyse a number of elements simultaneously without destroying the sample, and the high sensitivity for different elements ranging from 0.1 to 106 ppb [43].
The NAA method has been successfully applied to determine the metal content in different sample matrices. NAA was used to determine heavy metals in green tiger shrimp (Penaeus semisulcatus) and blue crab (Portunus pelagicus) from the Persian Gulf and the metals concentrations in crab and shrimp were (1.91 -25.43), (21.38 - 8.28), (0.15 - 0.40), (62.87 -288) and (66.64 -68.73) ppm for manganese (Mn), arsenic (As), cobalt (Co), iron (Fe), and zinc (Zn), respectively [44]. Vanadium (V), As, Cd, Cr, Cu, Fe, Mn, Ni, and Zn were detected in fish samples from an irrigation facility located in the East Region of Ghana. The measurements were conducted via NAA. Concentrations were 0.23, 0.02, 0.2, 1.03, 45.95, 19, 0.21, 0.27 and 12.76 ppm respectively [45].
Anodic stripping voltammetry (ASV)
ASV is an electro-analytical technique in which reducing potential is firstly applied to the working electrode for a period of time which subsequently leads to the accumulation of the reduced analyte species onto its surface. Afterward, an oxidizing potential sweep is applied to the electrode and the analyte is re-oxidized at its characteristic oxidation potential, and the cathodic current generated is proportional to the amount of analyte initially deposited onto the electrode [46].
Mercury is most commonly used electrode specifically for the determination of a number of elements, as it provides the chance for the investigated element to form an amalgam, rather than just adsorbing to the electrode surface. Mercury electrodes may be organized as either a hanging drop or a thin film. The thin-film mercury electrode may yield lower LODs, while the hanging mercury drop is simpler and less prone to contamination. ASV has been utilized as a very sensitive, low-cost, and consistent analytical procedure applicable for trace metals detection in a variety of matrices including environmental, clinical and industrial samples [47].
However, using stripping voltammetry the number of the measurable element is only about 20 elements compared with more than 70 for most atomic spectrometry analytical techniques [48].
In a recent study, the ASV method was used for the determination of traces of lead (Pb) in Hatyai city tap water. Pb was found to be in the range of 0.0 – 0.8 μg/l. The results of Pb2+ using the ASV method were compared with ICP-OES and had good agreement [49]. A sequential injection analysis-anodic stripping voltammetry (SIA-ASV) using bismuth screen-printed carbon nanotubes electrodes (Bi-SPCNTE) method was developed for the detection of trace heavy metals Pb, Cd, and Zn in herbal materials. Under optimal conditions, such as linear ranges and LODs, were found to be (2–10 and 12–100) ppb, and (0.2, 0.8 and 11) ppb for Pb, Cd, and Zn respectively [50].
Conclusion
An extensive range of analytical methods are available for trace element analysis, a number of which have been addressed in this review. The type of sample and concentration range of heavy metal influence the selection of the technique to be used. Overall it was found that atomic absorption/emission spectroscopy techniques could provide not only analysis of wide range of heavy metals but also ensure immense reliability by exhibiting good precision and accuracy at trace level.
Declarations
Acknowledgement
References
Archives


News Updates